Getting Started
Installation
wind-stats can be installed via pip from PyPI.
Wind Turbine
Wind turbine can be defined as follow :
In [1]: from wind_stats import WindTurbine
In [2]: from wind_stats.units import units
# https://en.wind-turbine-models.com/turbines/1467-siemens-swt-3.3-130-ln
# Power curve data
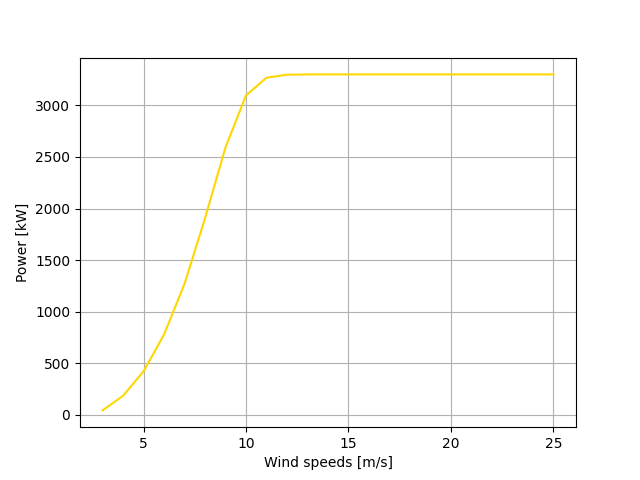
In [3]: wind_speed = [3, 4, 5, 6, 7, 8, 9, 10, 11, 12, 13, 14, 15, 16, 17, 18, 19, 20, 21, 22, 23, 24, 25] * units("m/s")
In [4]: power = [43., 184., 421., 778., 1270., 1905., 2593., 3096., 3268., 3297., 3300., 3300., 3300., 3300., 3300., 3300., 3300., 3300., 3300., 3300., 3300., 3300., 3300. ] * units.kW
In [5]: wind_turbine = WindTurbine("Siemens SWT-3.3-130 LN",(wind_speed, power), 130, 135)
In [6]: wind_turbine
Out[6]: <WindTurbine>(Siemens SWT-3.3-130 LN, 3.3 MW, height:135 m, diameter:130 m)
In [7]: In [1]: import matplotlib.pyplot as plt
   ...:    ...: plt.xlabel("Wind speeds [m/s]")
   ...:    ...: plt.ylabel("Power [kW]")
   ...:    ...: plt.grid()
   ...:    ...: plt.plot(wind_speed.m, power.m, color="gold")
   ...:
Out[7]: [<matplotlib.lines.Line2D at 0x71a361961bd0>]
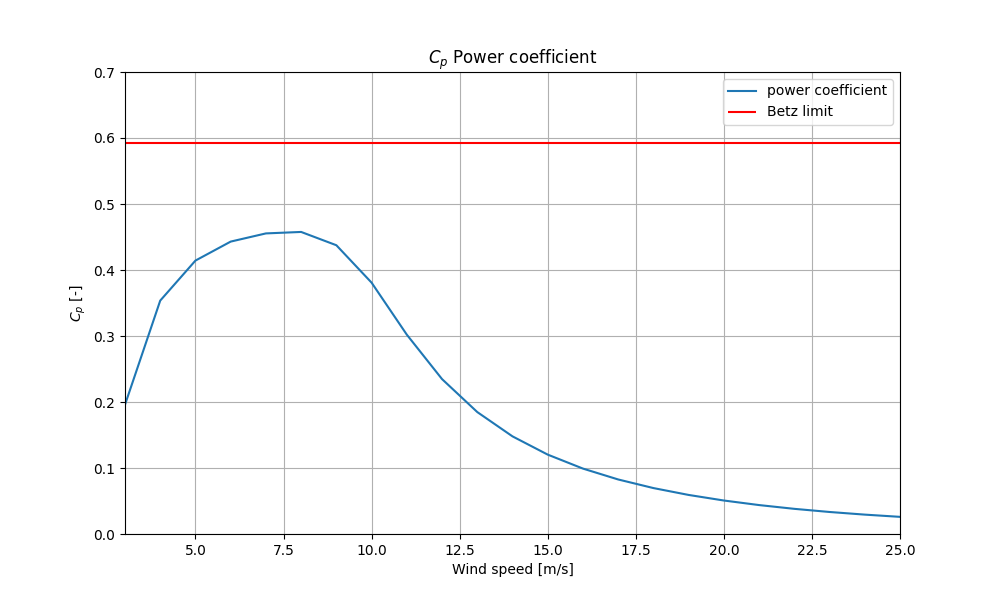
In [8]: wind_speed, cp = wind_turbine.get_power_coefficients()
   ...: plt.figure(figsize=(10,6))
   ...: plt.plot(wind_speed, cp, label="power coefficient")
   ...: plt.hlines(16/27, 0, 25,color = "red", label="Betz limit")
   ...: plt.title("$C_p$ Power coefficient")
   ...: plt.xlabel("Wind speed [m/s]")
   ...: plt.ylabel("$C_p$ [-]")
   ...: plt.xlim(3, 25)
   ...: plt.ylim(0, 0.7)
   ...: plt.grid()
   ...: plt.legend();
   ...:

In [9]: plt.show()
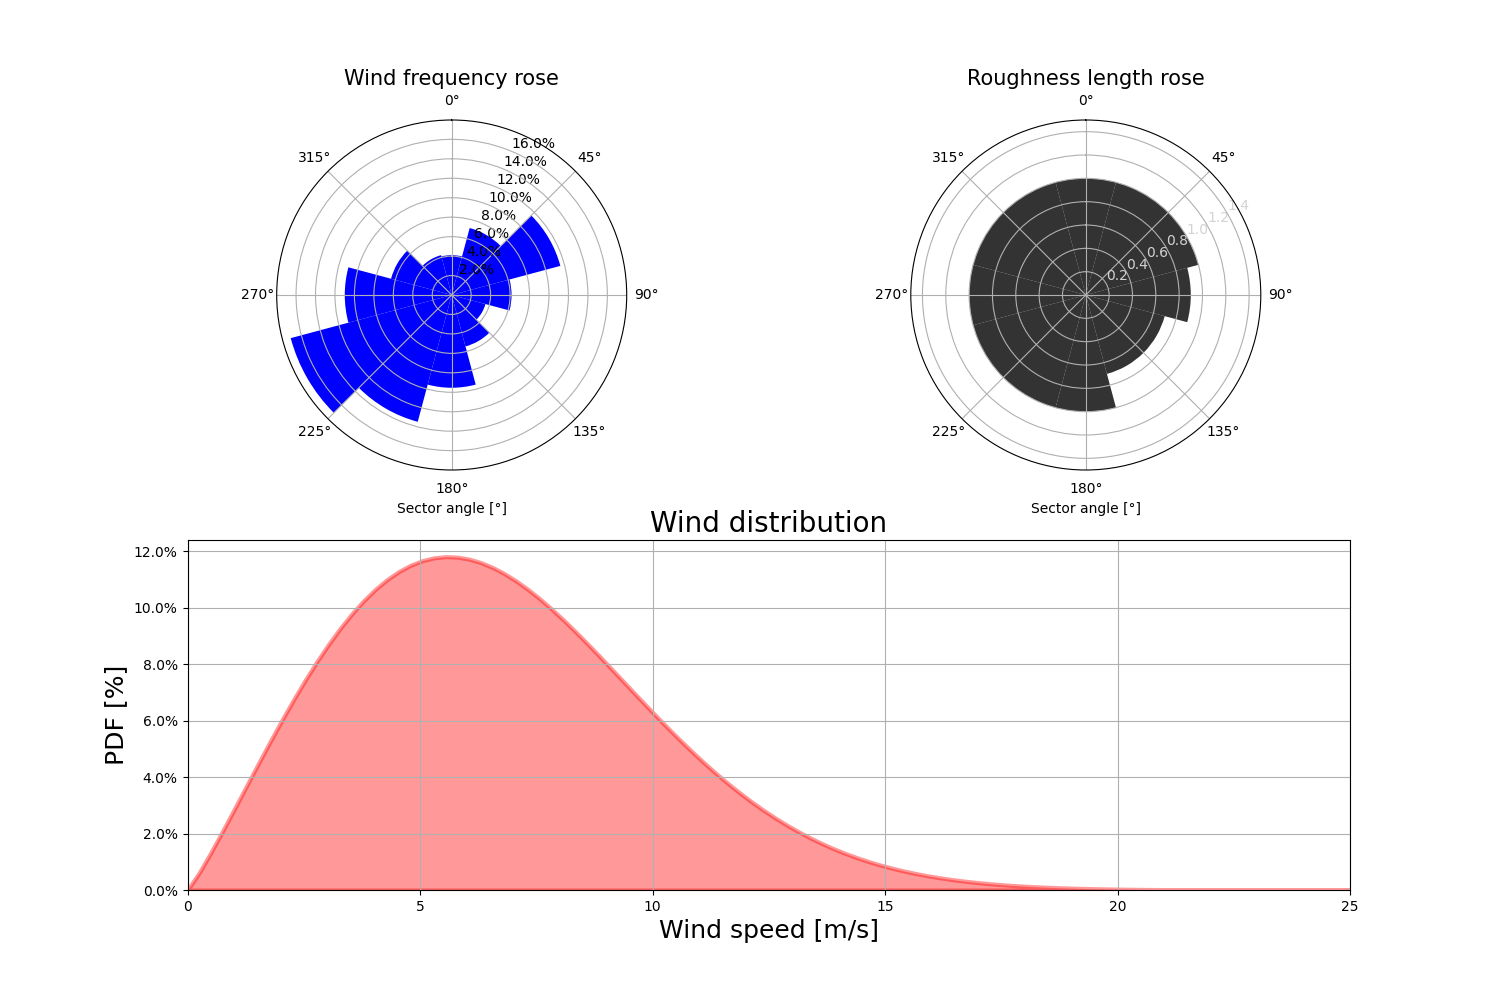
Wind Distribution
To evaluate energy production, one need to know the wind distribution at the site the wind turbine is going to be installed.
To do that wind-stats is making things easy for you with using WASP compatible files that can be downloaded with Global Wind Atlas.
GWC (Global Wind Climate) File can be downloaded through the Global Wind Atlas or with get_gwc_data function.
Note
The generalized wind climate file, also known as a wind atlas file, contains the sector-wise frequency of occurrence of the wind (the wind rose) as well as the wind speed frequency distributions in the same sectors (as Weibull A- and k-parameters).
Important
You need to install requests to use get_gwc_data function.
See also
More options are available to generate wind distribution.
In [10]: from wind_stats import get_gwc_data

In [11]: latitude, longitude = 48.4569 , 5.583

In [12]: gwc_data = get_gwc_data(latitude, longitude)

In [13]: gwc_data
Out[13]:
<xarray.Dataset> Size: 6kB
Dimensions:    (roughness: 5, height: 6, sector: 12)
Coordinates:
  * roughness  (roughness) float64 40B 0.0 0.03 0.1 0.4 3.0
  * height     (height) float64 48B 10.0 50.0 100.0 150.0 200.0 250.0
  * sector     (sector) float64 96B 0.0 30.0 60.0 90.0 ... 270.0 300.0 330.0
Data variables:
    A          (roughness, height, sector) float64 3kB 5.43 6.77 ... 6.33 6.58
    k          (roughness, height, sector) float64 3kB 2.308 2.439 ... 2.51
    frequency  (roughness, sector) float64 480B 4.12 5.4 9.48 ... 6.52 4.66
Attributes:
    coordinates:  (48.45, 5.575)
Or with a downloaded GWC file through Global Wind Atlas interface:
In [14]: from wind_stats import GWAReader

In [15]: with open("gwa3_gwc_j9mubhkw.lib") as f:
   ....:    gwc_data = GWAReader.load(f)
   ....:
Weibull A- and k-parameters & frequencies are interpolated provided hub-height & roughness length for each wind sector to generate the Weibull wind distribution.
See also
Roughness length user guide can help you evaluate roughness length at your site.
In [16]: from wind_stats import WindDistribution

In [17]: import matplotlib.pyplot as plt

In [18]: roughness_lengths_distribution = [1, 1, 1, 0.9, 0.7, 0.7, 1, 1 , 1, 1, 1, 1]

In [19]: wind_distribution = WindDistribution.from_gwc(
   ....:     gwc_data,
   ....:     roughness_lengths_distribution,
   ....:     wind_turbine.hub_height.m
   ....: )
   ....:

In [20]: wind_distribution
Out[20]: <WindDistribution>(type: weibull_min, mean: 6.6961 m/s)
Site
A Site is defined with GPS coordinates (latitude, longitude) & wind distribution.
In [21]: from wind_stats import Site

In [22]: site = Site(latitude, longitude, wind_distribution)
Tip
You can generate site from Global Wind Atlas wind distribution :
from wind_stats import Site

Site.from_gwc(latitude, longitude, roughness_lengths_distribution, height)
After defining our site we can now evaluate our annual energy output:
In [23]: annual_energy = wind_turbine.get_annual_energy_production(site).to("MWh")

In [24]: print(annual_energy)
11707 MWh
In [25]: energy = wind_turbine.get_energy_production(site, 3 * units.months).to("MWh")

In [26]: print(energy)
2926.7 MWh